Illuminating Insights: The Art and Science of Data Visualization
Illuminating Insights: The Art and Science of Data Visualization
In an age driven by data, the ability to effectively communicate insights is paramount. Enter data visualization, an artful fusion of design and science that transforms raw data into visually captivating narratives. This article delves into the fascinating realm of data visualization, exploring its role in simplifying complexity, aiding decision-making, and revealing hidden patterns.
Understanding Data Visualization:
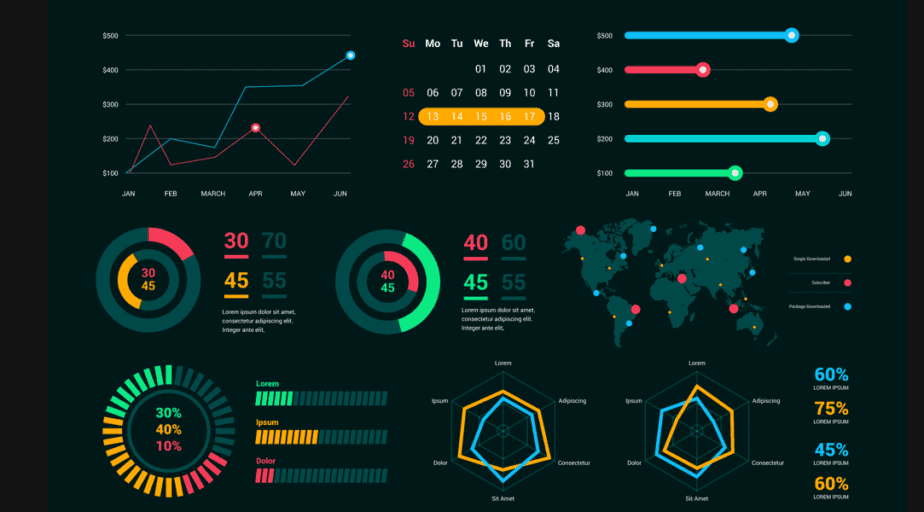
Data visualization is the process of translating data into visual formats, enabling quick comprehension and insight extraction. This creative practice involves presenting data through charts, graphs, maps, infographics, and interactive dashboards, making complex information more accessible to a broader audience.
The Power of Visual Representation:
-
Simplifying Complexity: Complex datasets can overwhelm even the most seasoned analysts. Visualization distills intricate data into clear, digestible forms, making it easier to identify trends, outliers, and relationships.
-
Enhancing Communication: Visuals are universally understood, transcending language barriers. By presenting data visually, complex concepts can be communicated more effectively to diverse audiences.
-
Enabling Discovery: Visualization encourages exploration. Interactivity allows users to manipulate visualizations, uncovering insights by drilling down into specific aspects of the data.
Effective Visualization Techniques:
-
Charts and Graphs: Line charts, bar graphs, scatter plots, and pie charts help represent quantitative data and relationships in a visually intuitive manner.
-
Maps and Geospatial Visualizations: Geographical data is transformed into interactive maps, aiding in the identification of spatial patterns and trends.
-
Infographics: Infographics combine visuals and text to present information in a concise, engaging format, making it ideal for conveying statistics, processes, and comparisons.
-
Network Visualizations: Complex relationships within networks are represented using nodes and edges, offering insights into connections and dependencies.
Data Storytelling:
Data visualization is not just about presenting facts—it's about telling a compelling story. Data-driven narratives guide viewers through the insights, helping them understand the context and significance of the information presented.
Impact on Decision-Making:
Effective data visualization can significantly influence decision-making across various domains. From business strategies to public policy, visualizations empower stakeholders to make informed choices by presenting evidence-backed insights in an easily digestible form.
Emerging Trends:
As technology evolves, so too do data visualization techniques. Augmented reality (AR) and virtual reality (VR) are opening new dimensions for interactive data exploration. Machine learning-driven visualization tools are automating the process of selecting appropriate visualizations based on data characteristics.
Final Thoughts:
Data visualization transcends mere aesthetics; it's a powerful tool that bridges the gap between data and understanding. By transforming complex data into visually engaging narratives, we empower individuals across diverse fields to make informed decisions, derive meaningful insights, and contribute to progress and innovation.
In conclusion, data visualization stands as a bridge between the world of data and the realm of comprehension. Its ability to distill complexity into clarity, to turn information into insight, is a testament to the synergy between creativity and analysis. As technology continues to evolve, so too will the ways in which we visualize data, continually enriching our understanding of the world around us.
512 0 7
Write a Comments
* Be the first to Make Comment


Recent Posts

Web Development

Mental health

Affiliate marketing graph...

Tech in Health care:-How...

Virtual Reality

Unlock Your Creativity wi...

Health and fitness equipm...

Cryptocurrency- The Futur...

Case studies
